The Rising Cost of Pharmaceuticals
My first approach to my project was to analyse how much the NHS pays for pharmaceuticals and try to identify any trends. For this I went to the NHS Prescription Cost Analysis monthly database homepage. This page contained all the Excel download links for monthly data going back to 2008 and containing information on a long dataset of medical and pharmaceutical supplies. I then decided to create an automated and replicable method of combining all these datasets. This turned out to be a huge undertaking with many hurdles. First, I built a python loop that would scrape the page for all 159 excel links and make a Beautiful Soup of all identifying codes. (Many turned out to have old excel formats and different naming)
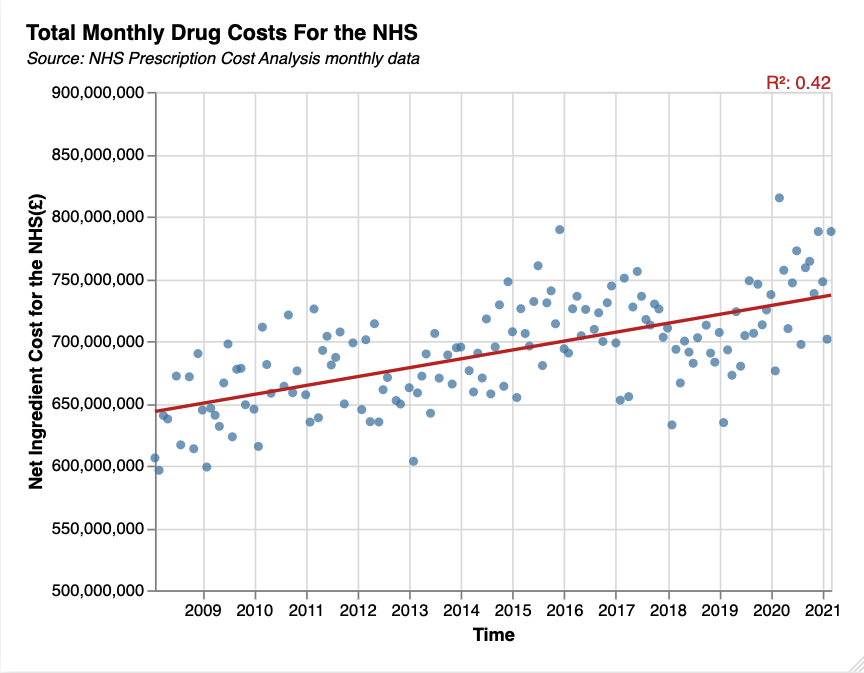
My next loop cycled through the codes using a base format and each excel file into a data frame. I later came back and added an if and an if not loop since I realised that the more recent files had a different header structure. The final part of the loop was to convert all the data frames into csv files and then download them. With 2.81 million observations and about 1.5GB of datasets this required me to change the code to zip all the datasets loaded in its directory and then download the more manageable zip files. After unzipping the downloaded folder, I created loops in a Stata do-file that would load the 159 files and append them into one large dataset. This code also tidied the data, generated year and month variables and adjusted and combined the Net Ingredient Cost which were measured in pounds in the recent PCA reports but pence in older ones. Finally I wrote an R-script that would load the large database and aggregate variables and output a csv file so as to use for charts in a more manageable format. [PYTHON SCRAPER & BULK DOWNLOADER CODE] [STATA APPEND & TIDY LOOPS CODE] [R SCRIPT FOR AGGREGATES CODE] These enable someone to replicate this process and only need to set the file directories and unzip a folder. There were many issues in the process but it now all works efficiently and means you can easily transfer somebody this enormous dataset by just giving them the code and be able to update it when new data is published.For my first chart I will inspect how the total Net Ingredient Cost faced by the NHS has changed since 2008 and fit a linear regression. Whilst the R squared value is only 0.42, suggesting a weak fit to the data, we can clearly see an upwards trend.
Code: JSON
My second chart interactively plots the breakdown of the categories of pharmaceuticals contributing to this increase. Diabetes drugs are clearly the largest contributor to these costs and so I have made it so you can interactively switch to see its steep upwards price trend.
Code: JSON
To check if this rise in cost is a result of higher quantites being required I next plot the quantity distributed across time. In the main charts there are no obvious time trends and only seasonal changes in demand yet when we switch to diabetes drugs we can see an upwards trend so require further investigations to decide how this affects the overall costs.
Code: JSON
I then regressed the diabetes expenditure per person against the deaths attributable to diabetes using data from The Diabetes Atlas but saw inconclusive results
Code: JSON
Finally I chart the average out of pocket costs for diabetics by country using data from The T1International Diabetes Survey which show how much the burden faced by individuals varies with the USA being exceptionally high for a developed economy. This introduces the logical extension to this project which would be to analyse the changes in drug prices in other countries and investigate whether these are being pushed higher by pharmaceutical companies using patents.
Code: JSON
Conclusions:
This project has laid the groundwork for future investigations through automation. From our large dataset we saw that costs to the NHS are rising and that it does not appear to be the influence of greater demand but instead a rise in price levels, specifically in drugs such as insulin for diabetics. Therefore, shows the need for further extensions and investigations for evidence into whether companies are artifically raising prices, how this affects international prices and the detrimental effects caused by this.